Sometimes It's Better to Confront Your Problems Head On: Engineering Simulation of the Titanic Disaster
What if the Titanic had rammed the iceberg head-on? What is Finite Element Modeling engineering simulation, and how it chooses its simplifications to put physics-accurate structural behavior prediction in the palm of your hand.
Abstract
We rebuild the Titanic's final moments as a measured simulation, to answer a counterfactual the 1912 inquiry itself raised: if the ship had rammed the iceberg head-on instead of turning, would she have survived?
1. The question
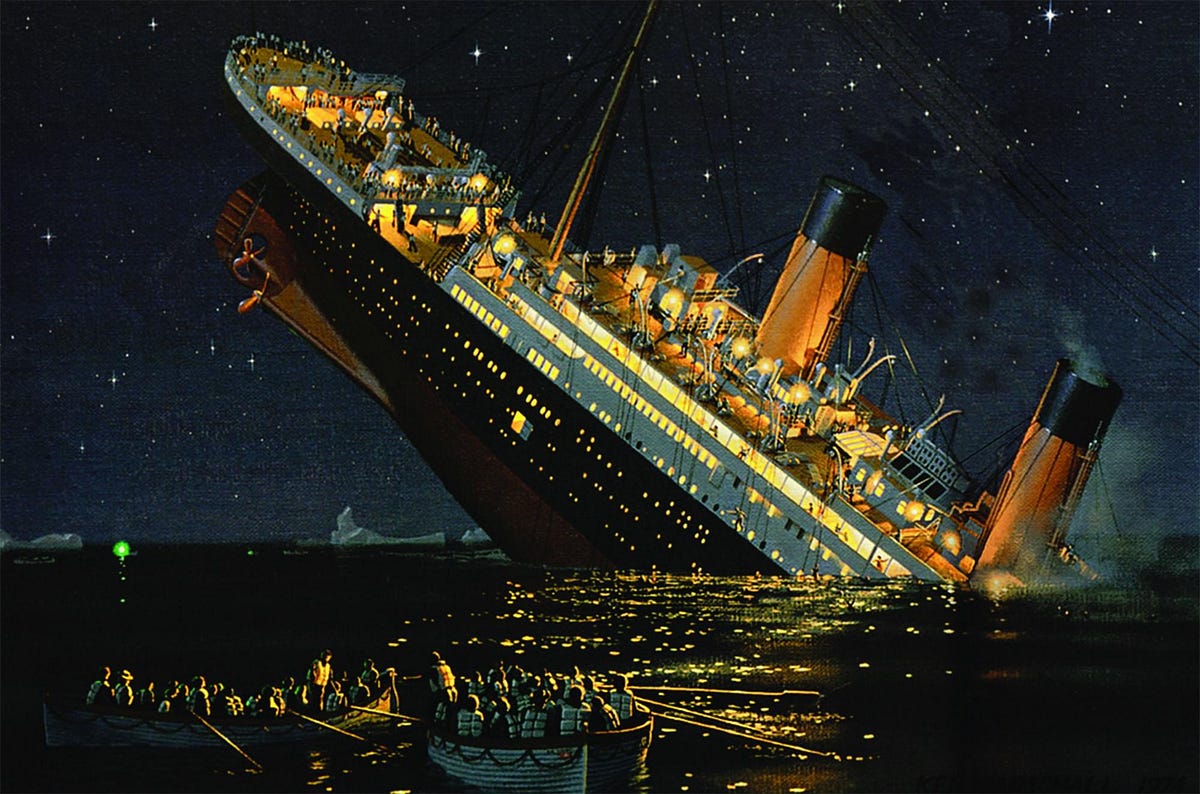
On the night of April 14, 1912, the Titanic's lookout saw the iceberg and the officer of the watch did the human thing: he turned. The ship answered the helm just enough to trade a head-on collision for a glancing blow — a long, shallow wound opening the ship's side across five or six forward compartments. Her watertight bulkheads only reached partway up; as the flooding bow dragged the ship down at the nose, water topped each bulkhead in turn and filled the next compartment. She sank by sequence, not by a single wound.
At the British inquiry weeks later, the shipbuilder's own naval architect, Edward Wilding, was asked the question this program now measures. His answer, verbatim from the transcript: "I am quite sure she would [have been saved], My Lord. I am afraid she would have killed every fireman down in the firemen's quarters, but I feel sure the ship would have come in." Pressed on the mechanism: "The momentum of the ship would have crushed in the bows for 80 or perhaps 100 feet" — and, he estimated, stopped before the second bulkhead, leaving fourteen compartments dry. A head-on strike trades a long tear along many compartments for a brutal crush of one or two. The program's pipeline exists to check that 1912 expert estimate with modern measurement: crush distance, deceleration, casualties in the crushed zone, and the flooding verdict.
To measure any of that, the simulation has to break the hull the way the real hull broke. Which brings us to the rivets.
2. What actually broke in 1912
The popular picture is torn steel. The metallurgy says otherwise. When hull pieces were recovered from the wreck and sectioned at the U.S. National Institute of Standards and Technology, the plates' steel told one story — brittle at ice-water temperatures — but the sharper finding was in the rivets. Wrought iron normally carries 2–3% slag (glassy silicate residue) by volume. The sectioned Titanic hull rivet measured 9.3 ± 0.3% — more than three times normal — arranged partly in long stringers, and near the formed head those stringers lie perpendicular to the load: the weakest possible orientation, exactly where the rivet must hold hardest. NIST's conclusion was that rivet failure, not plate failure, is "the most likely candidate for becoming a quantifiable metallurgical factor" in the loss (see the NIST report).
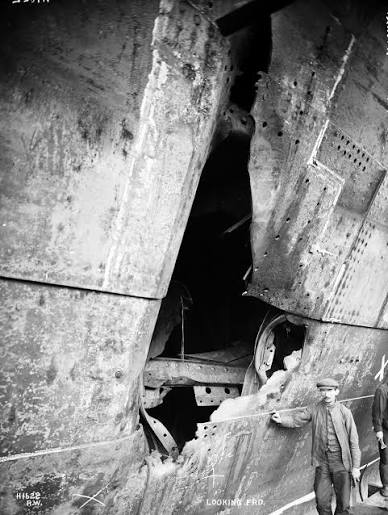
There is even a photographic control experiment. When Titanic's sister ship Olympic was rammed by the cruiser HMS Hawke in 1911, image analysis of the damage shows more than fifty rivets simply missing around the impact zone — heads popped, shanks gone, seams held only by their neighbors. Hulls of this construction fail at their seams. A model that cannot fail at its seams is a model of some other ship.
3. Two ways to model three million rivets
So the rivets must be in the model. The engineering question is how. There are exactly three options, and one of them is dishonest: ignore the rivets (a homogeneous hull — which contradicts the NIST evidence the study cites, and gets the failure mode wrong); model them discretely, every rivet a little structure of its own; or smear them — keep the seam lines in the model as strips of measured weakness, without individual rivets. The interactive figure below shows the same piece of hull both ways, with the computer's own accounting running live.
The discrete option founders on two rocks, and only one of them is the computer. A rivet is not a dot: it is a hole through two overlapping plates, a shank clamping them, friction between the laps. Capturing one rivet's pop-out costs on the order of a hundred small elements plus its own contact calculation. Three million rivets at that price is hundreds of millions of elements — three to four orders of magnitude beyond what this program's cluster (or most clusters) can crush through — against the 10,000 to 50,000 elements the whole-ship model is designed to run.
The second rock is the honest one: the data does not exist. The program's 3D Titanic is a visual model with no rivet geometry, and the historical record gives rivet strength as a statistical property — a distribution with large scatter driven by that slag — not a per-rivet map. A discrete model would be three million precisely placed guesses wearing the costume of precision. Simulation ethics has a name for that: false fidelity. The model would look more real and be less honest.
4. How a crush model earns trust
A mesh alone proves nothing. Before any historical structure is solved, the crush physics must earn trust on cases with known answers: small test articles — a box tube crushed end-on into a wall — compared against closed-form theories published in the crashworthiness literature in 1983–84. This is the validation ladder: no rung of complexity is attempted until the previous rung passes. A first coarse test typically reads high against theory, and that is the part of engineering culture this paper most wants to teach: a surprising first number is not a failure — it is a diagnosis. Each gap between measurement and theory must be understood and priced (a short tube develops fewer folds; a fast test adds dynamic overshoot; a coarse mesh stiffens folds) before the model advances a rung.
How the solver actually thinks: one equation, one algorithm, one relaxation
Strip away the software and finite-element analysis is one idea from physics and one idea from arithmetic. The physics idea: a structure at rest sits where its stored energy is lowest, like a ball at the bottom of a bowl. Write that stored energy as a formula — step 2 of the figure below: the "spring" energy of every element, minus the work the applied forces would do — and "the bottom of the bowl" becomes an equation: the point where every internal push exactly balances every external one. For a real mesh that is not one equation but hundreds of thousands, all coupled, because every element leans on its neighbors.
The arithmetic idea is how the computer finds that bottom, and it is humbler than most people expect — step 3: guess a deformed shape, measure the leftover unbalanced force the guess leaves behind, use the local stiffness to correct the guess, and repeat. That loop is Newton's method, and its signature is dramatic: once a guess is close enough, each pass roughly squares the error that is left. Squaring sounds like it should make the error bigger, and it would — if the error were bigger than one. By that stage it is a fraction, and squaring a fraction drives it down hard: 10% becomes 1%, and 1% becomes 0.01%. So an imbalance of hundreds of percent collapses to a fraction of a percent in a handful of corrections. Engineers call that curve "relaxation" for the right reason: it is the structure being allowed, iteration by iteration, to settle into the shape the physics demands — and in step 4 you can watch it: a lattice of nodes and springs jiggling its way downhill in energy until the stored energy bottoms out. Step 1 in the figure animates the process and shows it's result — a test article mid-crush, colored by accumulated plastic strain: red where the metal has permanently folded, because the "spring" or "elastic" nature or deformation range of the metal has been overcome, and it has entered the permanent, "plastic" regime, and blue where it is still elastic; that quantity, not stress or load, as in the new resting state post-crush, the load imbalances have all been resolved, is what visually separates crushed metal from merely loaded metal, because stress saturates at the material's flow strength once metal yields.
5. The tradeoff, priced
| Model every rivet | Smear the seams | |
|---|---|---|
| Elements, whole ship | ~300,000,000+ | 10,000–50,000 |
| Contact problems | ~3,000,000 | dozens |
| Memory | hundreds of GB | a few GB |
| Runtime, one compute node (order-of-magnitude engineering accounting) | years-to-centuries class | hours-to-days class |
| Input data honesty | 3M per-rivet guesses (only statistical data exists) | seam strength calibrated from published rivet tests |
| Individual rivet events | yes | no — stated lower bound on local realism |
| Failure mode (seams weaker than plate) | yes | yes |
| Reproducible & auditable | practically never rerun | every run re-runnable, ledgered |
Notice what the smeared column does not give up: the failure mode. The seams remain the weak paths, at the measured strength, in the measured places. What it gives up is local theater — no individual rivet pops, no seam unzipping rivet-by-rivet, and the rivet-to-rivet scatter that slag creates collapses into one average with an uncertainty band. The study's fidelity contract records this in exactly those words: a smeared seam is a lower bound on local realism, and the paper built on it must say so plainly, because the rivet mechanism is what the historical comparison turns on.
6. Conclusion
The Titanic crash/crush model is tractable because it smears its rivets in a way the evidence can actually support: as measured seam weakness, not as three million individually invented parts. The discrete alternative costs four orders of magnitude more computer and is still a guess as to the accurate arrangement of the rivets, without the detailed engineering blueprints of the ship. The smear keeps the failure mode, fits the machine, stays auditable, and carries both its price tag (a stated lower bound on local realism) and its tripwire (a sensitivity test that can overturn it). That is what a good simulation decision looks like from the inside: not the most realistic model in terms of atom-level accuracy, but still an honest one in that the method is proven to generate realistic end-state results.
7. The result: she comes in
The measurement the preceding sections were written ahead of has now been run, on the modeling decision exactly as priced above. The forward 60 metres of hull — meshed, plated, decked, bulkheaded, seams smeared per §3 — was driven into a rigid ice face at 22.5 knots, with the remaining 209 metres of ship riding in as 52,000 tonnes of momentum behind it. Nothing about the outcome was prescribed: the solver steps the collision forward a fraction of a millisecond at a time, and the bow does whatever the steel and the arithmetic make it do. The apparatus lives in §8; this section is what it said.
It folds. The film below is the solved run played back at real geometry, coloured by the same accumulated plastic strain Fig. 6 taught: blue is metal that is merely loaded and would spring back; orange and yellow is metal that has folded for good.
Twenty-four and a half metres — 80 feet — of bow consumed, in under four seconds. Wilding said "80 or perhaps 100 feet." The measurement lands on the lower edge of his band and stops seven and a half metres short of bulkhead B at the 32-metre station. On the question he was actually asked, the 1912 estimate and the 2026 simulation agree.
Two details the testimony could not have supplied. First, the deceleration is survivable: about a third of a gravity, sustained for the four seconds of the crush, with a brief spike near 0.9 g in the first hundredth of a second as the stem takes the ice. That is a hard bus stop, not a wall — nobody aft of the damage is killed by the stopping itself. Wilding's grim aside about the firemen is nonetheless correct, and the film shows why: it is not the deceleration that kills them, it is that the first 24 metres of the ship, where they berthed and worked, ceases to exist. Second, the ship rebounds: peak intrusion is 24.5 m, but roughly 2.8 m of that is elastic — the bow springs partway back as the stored energy releases. Peak intrusion is what determines whether a bulkhead is reached, so it is the number quoted against Wilding.
The condition on that answer
A ship's bow is not a steel box; it is plating stiffened by a dense grid of frames, stringers and web plates that the model does not resolve individually. Their contribution enters as one number — a smeared framing factor multiplying the plating's effective stiffness. The run above uses 1.5. That choice is not measured, and the answer moves with it — so it was swept, three arms run concurrently across the program's cluster:
| Framing factor | Bow crushed | Mean crush force | Reaches bulkhead B (32 m)? |
|---|---|---|---|
| 1.0 — bare plating | 40.0 m | 86 MN | yes — she does not come in |
| 1.5 — the reported run | 24.5 m | 145 MN | no — 7.5 m to spare |
| 2.0 — heavily framed | 18.1 m | 193 MN | no — 14 m to spare |
So the study does not independently prove Wilding right. It establishes something more useful and more checkable: stopping the ship inside 80–100 feet requires a mean crush force of 118–148 MN, and a structural framing (stringers, etc.) of the bow of an ordinary merchant ship delivers it. The reported arm produces 145 MN, at the top of that window. A bare unframed shell produces 86 MN and fails the test outright. Wilding's estimate is not a lucky guess; it is the answer a correctly-stiffened bow gives, and the sweep is what pins that down. Whether Titanic's actual forward framing was worth a factor of 1.5 is a question for her construction drawings — which is precisely the check this parameter still owes, and it is now the single largest open item in the study.
Where the damage stops — and whether she floats
"Stops before bulkhead B" is a clean sentence, and the first version of the figure below drew it as a clean line: everything forward of the crush destroyed, everything aft pristine. That was wrong, and checking it changed the conclusion. Reading the plastic strain along the model's seam strips — the smeared rivet rows of §3, doing exactly the job they were built for — shows heavy straining, around 7% mean permanent strain, continuing to about 30 metres, well beyond the 24.5 metres of outright crushing. The boundary is sharp when it comes: at the 32-metre station the mean seam strain collapses to 1.7%. But that boundary is at bulkhead B's own station, not comfortably forward of it. The conservative reading is therefore not "compartment 1 floods" but compartments 1 and 2 both flood.
Which raises Wilding's real claim. He did not say the bow would be undamaged; he said the ship would have come in. So: flood the damaged compartments and see whether she stays up. A screening hydrostatic calculation floods each forward compartment in turn, adds the water as weight, finds the new sinkage and trim — then asks the question that actually sank her: does the tilted waterline reach the top of the aftmost flooded bulkhead? If it does, water spills into the next compartment and the sequence becomes unstoppable.
| Flooded back to | Compartments open | Water aboard | Bow-down trim | Margin at bulkhead top |
|---|---|---|---|---|
| bulkhead B (32 m) | 2 | 1,160 t | 0.93 m | +5.69 m — floats easily |
| bulkhead C (48.8 m) | 3 | 2,620 t | 1.89 m | +5.18 m — floats |
| bulkhead D (65.5 m) | 4 | 4,710 t | 3.01 m | +4.64 m — floats |
| bulkhead E (83.8 m) | 5 | 7,790 t | 4.30 m | +1.16 m — the margin collapses |
Read the last column downward. Flooding two compartments — the measured damage — leaves nearly six metres of bulkhead standing clear of the water. Even flooding double the measured damage, back to bulkhead D, still leaves 4.6 metres. The margin holds, and then between the fourth and fifth compartment it falls off a cliff — and that cliff is the historical record: Titanic was designed to float with four compartments open, and the night she sank the collision opened five. This screen was not tuned to reproduce that boundary; it recovers it anyway, which is the self-check that earns it some of the credit it needs on the counterfactual.
The head-on collision crushes 24.5 metres of bow, kills everyone forward of the second bulkhead, and stops the ship in under four seconds at a third of a gravity. Two compartments flood. She floats with more than five metres of bulkhead in hand, and would still float on twice the damage. Fourteen hundred people who died in the water are, in this counterfactual, standing on a wrecked but floating ship — which is exactly what Edward Wilding told the court in 1912.
| Wilding, 1912 | This study (1.5× framing) | |
|---|---|---|
| Bow crushed | 80–100 ft (24.4–30.5 m) | 24.5 m — his lower bound |
| Time to stop | “three or four seconds, five perhaps” | 3.9 s |
| Mean crush force | 107–133 MN (implied by his energy arithmetic) | 145 MN, on our sourced 118–148 MN window |
| Deceleration | ~0.25 g (his motor-car analogy) | 0.3 g sustained |
| Damage extent | stops before the second bulkhead | stops 7.5 m short of bulkhead B |
8. Experimental
Everything in this section is machinery. It is placed last deliberately: a reader who wants the answer should not have to walk through the apparatus to reach it, and a reader who doubts the answer should find the apparatus complete.
8.1 The cluster
Runs execute on a self-managed three-node Kubernetes cluster (k3s), built for this program: three rented virtual servers, eight cores and 22 GB of usable memory each, at a flat $82.50 per month for the whole cluster. Measured latency between nodes is half a millisecond. Each node carries a labelled mount — one for data intake, one for finite-element work, one for crash — so a pipeline stage lands on the machine that owns that kind of work.
The three arms of §7's framing sweep ran as three Kubernetes Jobs, one per node, simultaneously — six solver threads each, identical container image, identical deck but for the one varied parameter. That is the cluster's actual value here and it is worth being precise about it: not a faster single run — three whole runs in the time of one. Explicit crash solvers of this size parallelize poorly across machines (the half-millisecond hop is slower than the calculation it would coordinate), so the cluster buys throughput, not speed. A parameter sweep is exactly the shape of problem that turns into.
8.2 The solver and the model
- Solver: OpenRadioss, explicit dynamics, run as a two-phase starter/engine chain inside a pinned container image. Explicit means the solver never solves a big system of equations; it steps forward in tiny increments — here about a microsecond — re-balancing forces as it goes (the time-marching sibling of §4's relaxation, exactly as Fig. 6's footnote promised). Roughly 330,000 to 400,000 such steps per run.
- Model: the forward 60 m of hull as a tapered box, 31,449 nodes and 32,800 quadrilateral shell elements at 500 mm — inside the 10,000–50,000-element budget §5's tradeoff table committed to. Hull plating 25.4 mm; decks 9.5 mm at six levels; three transverse watertight bulkheads at 10 mm; a bow face and stem; seam strips per §3; and an elastic aft collar carrying the remaining ship mass.
- Element formulation: fully-integrated shells (a formulation choice that suppresses the spurious zero-energy "hourglass" mesh modes that under-integrated elements suffer). Measured effect: hourglass energy falls to 3.7% of internal energy on the reported arm — reduced, not eliminated, which is itself a finding worth recording since the formulation is often described as curing the problem outright.
- Material: hull steel from measurements on plate recovered from the wreck — 193.1 MPa yield, 417.1 MPa ultimate, 29% elongation — entered as a piecewise-linear plastic curve. Not a handbook steel: recovered Titanic plate is measurably weaker than the nearest modern equivalent, and using the modern one would have overstated her.
- Loading: the whole structure initialised at 22.5 knots (11.575 m/s) toward a rigid planar wall 100 mm ahead of the stem; total mass 53,149.6 tonnes (52,310 long tons, the inquiry report's displacement).
- Validation: the ladder of §4, run in full before the ship was attempted — box tubes crushed against the Wierzbicki–Abramowicz and Abramowicz–Jones closed-form theories and against a published benchmark case, with the solver landing mid-band on dynamic amplification and closing its energy books to one part in ten thousand on the validation rungs.
8.3 How the crush distance is measured — and how it was measured wrong first
The reported run's energy books close to within 4.2%, with hourglass energy accounted separately rather than hidden inside the total — the audit habit §4's callout promised, kept. The crush distance itself was, at first, obtained wrongly, and the error is instructive enough to publish. The intuitive route is to convert the ship's remaining kinetic energy into a speed and integrate that speed into a distance. It overstates the answer — by 31% on the stiffest arm — because a crushing structure is ringing, and the vibration of thirty thousand elements counts as kinetic energy without moving the ship anywhere. The correct channel is momentum: internal motions cancel in the sum, so momentum divided by mass is the ship's actual velocity. A second, subtler version of the same mistake survived even that fix — taking the magnitude of the momentum rather than its sign, so that the elastic rebound after the stop was integrated as more forward travel instead of less, inflating the crush by a further 2.8 m on the reported arm. Both were caught the same way: by comparing the reduced number against the geometry visible in the film in Fig. 7. When a derived number and a picture of the same event disagree, the picture is usually right.
8.4 Reproducibility
Every run in this paper is defined by a generated input deck under version control, executed by a pinned container image, on a labelled cluster node, with its reduction script committed alongside. Each modelling decision carries a row in the program's fidelity contract recording its value, its source, its measurement tier (measured / historical / assumed / decision) and the condition that would overturn it. The failed tilted-face runs of §7 are retained with their ledgers rather than deleted; a negative result that cost three node-hours is still evidence.
Appendix — Wilding's own calculations: the 1912 mathematics this paper tests
Edward Wilding was Harland & Wolff's senior naval architect for calculations — the man whose department computed the Olympic-class ships' stability, subdivision and strength in the first place. At the British inquiry he produced four distinct pieces of quantitative reasoning, and they are worth setting out plainly, because one of them is the claim this paper measures and the other three are the 1912 ancestors of methods used elsewhere in it. Everything quoted below is verbatim from the inquiry transcript.
A.1 The head-on estimate: energy over distance, checked by kinematics and precedent
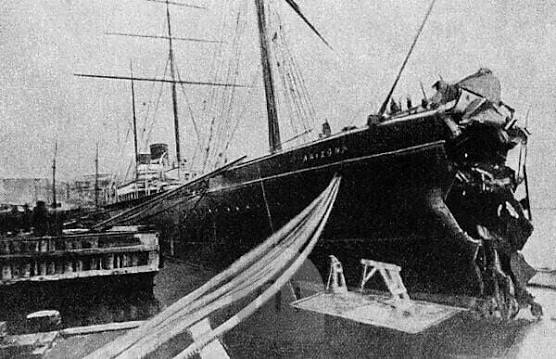
No worked calculation for the head-on scenario was entered into evidence — what the transcript preserves is an engineer reasoning aloud from numbers he clearly held. The examiner supplied the frame at Q.20266: "a body weighing 50,000 tons moving at the rate of 22 knots an hour." The kinetic energy of that body is about 1.07 million foot-tons. Absorbing it over Wilding's stated 80 to 100 feet of crushing demands a mean resistance of 10,700–13,400 tons-force — 107–133 MN. That is the identical energy-over-distance arithmetic §7 runs in reverse (our window, from the slightly different sourced displacement and speed, is 118–148 MN), and his implicit judgment — that a liner's bow structure crushes at forces in that range — came from the shipyard's own structural knowledge and from precedent he cited directly: the Arizona, which rammed an iceberg at speed in 1879, telescoped her bow, and steamed into port. Asked whether the ship would have "telescoped herself" (Q.20283–20284): "Yes, up against the iceberg… that is what happened in the 'Arizona.'"
His kinematics were explicit and internally consistent. At Q.20280: "As it would take a considerable length, 80 or 100 feet to bring up, it is not a shock, it is a pressure that lasts three or four seconds, five seconds perhaps." Under uniform deceleration the stopping time is 2s/v — 80 to 100 ft at 22½ knots gives 4.3 to 5.4 seconds, exactly his band. And his calibration of the deceleration's severity is the transcript's best line, Q.20282: "100 feet will pull up a motor car going 22 miles an hour without shooting you out of the front." That analogy encodes roughly a quarter of a gravity. The measured run in §7 says 0.3 g sustained. Every check this program can now run — crush distance, stopping time, mean force, deceleration — lands inside the bands he stated from the witness box.
A.2 The wound: "somewhere about 12 square feet"
This one he did compute, and stated the method in full (Day 19, Q.20422). Working backwards from the flooding: the evidence fixed how high the water stood roughly 40 minutes after the collision, and his flooding plans converted that state to a volume — "about 16,000 tons of water had found their way into the vessel." The vertical position of the damage gave the driving head: "the head would be about 25 feet." Water under a 25-foot head enters at a speed set by orifice flow (the Torricelli relation, √2gh, discounted for real openings); dividing the required inflow rate by that speed — "making allowance for the obstruction due to the presence of decks and other things" — gives the aggregate open area: "somewhere about 12 square feet." Spread over the damage length, "the average width of the hole… is only about three-quarters of an inch." The reconstruction is arithmetic: 16,000 tons in 40 minutes is about 230 cubic feet per second; a 25-foot head gives ~40 ft/s ideal inflow, ~24 ft/s with a standard discharge coefficient; 230/24 ≈ 10 square feet, and his stated allowances carry it to 12. A century before anyone photographed the wreck's bow, hydraulics told him the "300-foot gash" was actually a scatter of slits — which the wreck surveys later confirmed.
A.3 The flooding plans: 1912 damage stability
Wilding's third body of calculation (Q.20286–20345) is the direct ancestor of §7's flooding table: flood a chosen set of compartments on paper, deduct permeability — his stated assumptions were 5% of any space occupied by structure, one-quarter of cargo spaces occupied by "water-excluding materials," one-sixth for stores and mails — find the ship's new sinkage and trim, and ask whether the tilted waterline tops the aftmost flooded bulkhead. The runs were computed at the yard in Belfast during the inquiry, directed by wire ("I then told them at Belfast by wire to flood No. 2 compartment, also the forepeak, and see what happened"), with the departure draught scaled from the Olympic's measured consumption history. His condition-by-condition plans showed the historical five-compartment wound topping bulkhead E — the cascade — while any four stayed below the tops: the four-floats/five-sinks boundary that §7's screening calculation independently reproduces.
A.4 The foundering stress: the one he got wrong
Pressed on whether the hull broke apart at the surface, Wilding offered "the rough calculation I was able to make as to the probable stress arising when the ship foundered as she got her stern out of the water… It showed the stress in the ship was probably not greater than she would encounter in a severe Atlantic storm" (Q.20258–20264) — a hull-girder bending estimate against the design sea state, from which he concluded she sank intact. The wreck, found in two pieces, proved this the only one of his four calculations that failed — a useful caution, since it is also the only one whose input (the loading of a half-flooded, partially-raised hull) he could neither observe nor bound. The other three had a measurement or a precedent anchoring one end.
What makes these four worth an appendix is not nostalgia. Each is the same discipline this paper argues for: an energy or continuity budget, a stated assumption with its number attached, and — where he had one — an external anchor. He did it with a slide rule and a cable line to Belfast. The difference a century makes is not the method; it is that the crushing resistance he had to estimate from the Arizona is now a quantity a cluster can measure overnight.
AI Transparency Report
All experimental software setup and coordination, as well as validation and experimental runs, were orchestrated by Aaron Kushner using natural language requests and delivered judgements to his research workbench built on the Claude Code harness, running Opus or Fable depending on the work. Crush simulations computed with CalculiX on project workstation hardware during the validation arc; the §7 collision runs computed with OpenRadioss on the program's self-managed three-node k3s cluster. Figures rendered from the solved cases' own files — the animation in Fig. 7 and the profile in Fig. 8 by committed scripts, with no manual retouching; interactive figures drafted by a delegated GPT seat under pinned specifications and judged before inclusion; manuscript drafted and revised with Claude in Aaron Kushner's research harness. Every historical and metallurgical number was verified at its named source before use. Reported numerical results were re-derived from the time histories at the time of writing rather than quoted from earlier notes — a check that caught the rebound-sign error described in §8.3.
References
- Foecke, T. (1998). Metallurgy of the RMS Titanic. NIST-IR 6118, National Institute of Standards and Technology. — rivet slag content (9.3 ± 0.3%), slag stringer orientation, Olympic–Hawke missing-rivet analysis.
- Felkins, K., Leighly, H. P., & Jankovic, A. (1998). The Royal Mail Ship Titanic: Did a Metallurgical Failure Cause a Night to Remember? JOM, 50(1), 12–18. — tensile properties of recovered hull plate (193.1 MPa yield, 417.1 MPa UTS, 29% elongation), the material used in §8.2.
- Hooper, J. J., Foecke, T., Graham, L., & Weihs, T. P. (2003). The metallurgical analysis of wrought iron from the RMS Titanic. Measurement Science and Technology, 14, 1556. — the 35-rivet quantitative test program (the seam-calibration source; not yet obtained, see §7).
- British Wreck Commissioner's Inquiry (1912). Report — Description of the Ship; Findings of the Court. — displacement 52,310 tons; 15 bulkheads/16 compartments, watertight to C, D or E deck; compartment lengths 50–70 ft; speed "About 22 knots."
- Wilding, E. (1912). Testimony, British Wreck Commissioner's Inquiry, Day 19, Q.20258–20345 and Q.20420–20425. — the head-on estimate quoted verbatim in §1 and Appendix A.1; the flooding-plan method (A.3); the wound-area calculation (A.2); the foundering-stress estimate (A.4).
- Halpern, S. Somewhere About 12 Square Feet. Titanicology. — the modern reconstruction and audit of Wilding's wound-area calculation (Appendix A.2).
- Wierzbicki, T., & Abramowicz, W. (1983). On the Crushing Mechanics of Thin-Walled Structures. Journal of Applied Mechanics, 50(4a), 727–734. — mean crush force theory (the validation ladder's closed-form comparison, §4, §8.2).
- Abramowicz, W., & Jones, N. (1984). Dynamic Axial Crushing of Square Tubes. International Journal of Impact Engineering, 2(2), 179–208. — dynamic crush theory variant (§4, §8.2).
- McCarty, J. H., & Foecke, T. (2008). What Really Sank the Titanic. Citadel Press. — the accessible account of the rivet test program.